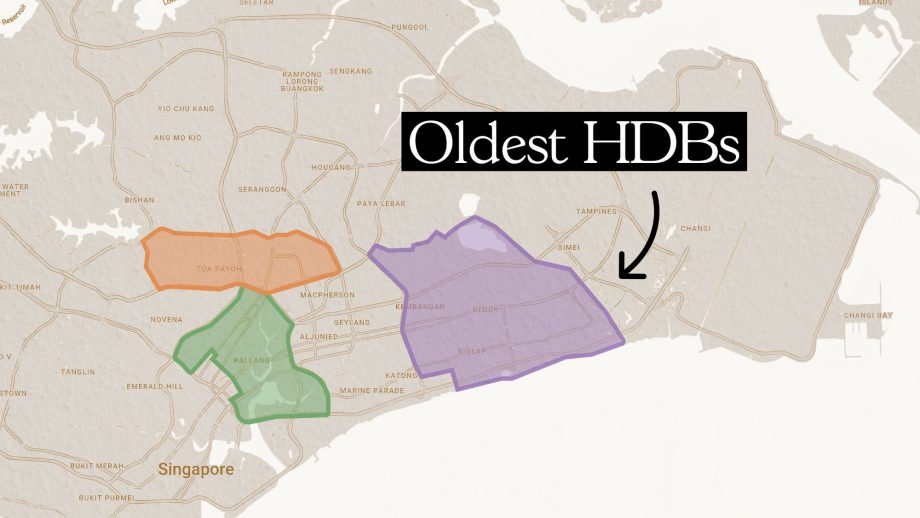
With the end of SERS, one of the predicted effects is a rush to sell off older HDB flats. Without any more chance at a lucrative, government-aided exit, those who still want to upgrade (or just move to somewhere with a longer lease) will likely make their move soon. But for older Singaporeans, this represents an unprecedented opportunity: perhaps now is your chance to snag a flat in a mature neighbourhood, at prices that are no longer as high. For these buyers, here’s a quick look at where you’ll find the oldest HDB flats (and the rough cost you might get them at):
What counts as an “old” HDB flat?
For all intents and purposes, we will consider these to be flats that are currently 50 years old or more (i.e., more than half the lease is over). These are typically found in the first wave of HDB towns built between the 1960s and 1970s: Toa Payoh, Queenstown, Bukit Merah, Marine Parade, and the Central Area.
| Year | BEDOK | BISHAN | BUKIT MERAH | BUKIT TIMAH | CENTRAL AREA | GEYLANG | HOUGANG | JURONG EAST | JURONG WEST | KALLANG/WHAMPOA | MARINE PARADE | QUEENSTOWN | TOA PAYOH | WOODLANDS |
| 2014 | $322,095 | $292,273 | $404,574 | $430,071 | $414,719 | $290,951 | $288,321 | $281,225 | $355,993 | $406,175 | $369,369 | $335,355 | $274,467 | |
| 2015 | $307,000 | $278,875 | $396,731 | $407,500 | $417,000 | $271,072 | $260,067 | $274,500 | $259,931 | $353,798 | $407,541 | $370,177 | $312,570 | $262,409 |
| 2016 | $286,435 | $269,126 | $364,129 | $379,000 | $399,299 | $265,405 | $252,838 | $250,000 | $253,550 | $335,963 | $402,551 | $366,712 | $302,803 | $248,838 |
| 2017 | $284,460 | $274,833 | $370,018 | $430,000 | $380,170 | $254,697 | $256,000 | $227,333 | $236,769 | $319,411 | $403,840 | $356,547 | $296,234 | $242,750 |
| 2018 | $265,895 | $262,056 | $337,727 | $417,143 | $382,423 | $247,391 | $232,000 | $225,333 | $215,170 | $309,993 | $393,055 | $331,769 | $265,780 | $224,526 |
| 2019 | $257,020 | $260,667 | $326,112 | $435,071 | $376,957 | $230,730 | $215,667 | $219,000 | $202,134 | $329,942 | $356,487 | $306,495 | $249,405 | $215,876 |
| 2020 | $266,875 | $258,156 | $336,837 | $417,222 | $377,838 | $224,295 | $222,236 | $222,000 | $222,450 | $317,295 | $353,689 | $310,168 | $249,440 | $217,250 |
| 2021 | $296,000 | $276,861 | $358,764 | $419,222 | $384,551 | $261,733 | $268,286 | $253,000 | $258,746 | $346,063 | $380,577 | $343,776 | $284,618 | $256,889 |
| 2022 | $320,954 | $302,579 | $381,478 | $448,286 | $410,000 | $294,697 | $309,464 | $277,235 | $365,981 | $412,677 | $358,563 | $328,395 | $296,000 | |
| 2023 | $347,375 | $334,455 | $402,297 | $468,667 | $404,800 | $309,694 | $319,148 | $325,000 | $292,858 | $362,885 | $439,862 | $378,269 | $344,082 | $304,375 |
| 2024 | $368,828 | $356,141 | $426,912 | $488,111 | $417,294 | $326,821 | $324,167 | $330,000 | $310,201 | $414,054 | $455,177 | $394,025 | $367,953 | $323,625 |
| 2025 (up till June) | $406,800 | $359,155 | $442,499 | $500,000 | $458,818 | $340,387 | $354,924 | $360,000 | $327,717 | $407,982 | $477,247 | $430,872 | $378,953 | $342,523 |
| % increase from 2014 to June 2025 | 26.30% | 22.88% | 9.37% | 16.26% | 10.63% | 16.99% | 23.10% | 16.53% | 14.60% | 17.50% | 16.65% | 13.00% | 24.80% |
Many of these older 3-room flats can be found in Bedok, Kallang/Whampoa, and Toa Payoh, as seen from the consistent resale activity for flats built before 1975. Many of them are still changing hands at just under $400,000 on average.


