
As we write this article on the first day of the new year, 2026 is shaping up to not look exciting for Singapore’s property market. At this point, I think most of you will consider that a definite upside.
After the steep uptick in property prices during the post-Covid-19 pandemic recovery, a re-alignment in purchasing priority among some buyers from $PSF to absolute prices, and an uncharacteristic “why is everything in the Core Central Region (CCR)” trend, things may be finally going back to normal. Or at least, a semblance of normalcy, as some of the changes we saw in 2025 are likely here to stay.
As an upside, there’s even more completed properties entering the market and interest rates look set to moderate this year too, so buyers may finally catch the break they need. Here’s a rundown of the trends to expect:
1. For new launches, more family-centric options in the heartlands
There was a larger than normal proportion of new launches in the CCR in 2025, which accounted for close to a quarter (about 23 per cent) of new projects last year. This year, we’re seeing a return to the heartlands.
An estimated 65 per cent of new launches this year will be in the Outside Central Region (OCR). Some of the locations that will see new launches will include Tengah (we’ll see the first private condo for this area at Tengah Garden Avenue), Tampines, and Bayshore. Narra Residences, at Dairy Farm Walk in District 23, is also one of these launches and we’ll be reviewing it shortly.
For more details, you can also check out this list of 10 known sites for the first half of 2026.
For the primary market, this pivot back to the OCR will be important for two reasons. While most assume it’s an issue of cost, this isn’t entirely the case. While the average $PSF rose significantly in 2024/25, developers tried to keep the overall quantum within the affordable budget of most upgraders:
Volume by market segment in 2024 vs 2025 (non-landed homes excluding EC)

| 2024 | 2025 | |||||
| Region | New Sale | Resale | Sub Sale | New Sale | Resale | Sub Sale |
| CCR | 377 | 2291 | 50 | 200 | 657 | 30 |
| OCR | 3199 | 6209 | 756 | 4320 | 6002 | 405 |
| RCR | 2664 | 3868 | 476 | 6091 | 5402 | 452 |
Price movement by region (average $PSF) – non-landed homes excluding EC

| 2024 | 2025 | |||||
| Region | New Sale | Resale | Sub Sale | New Sale | Resale | Sub Sale |
| CCR | $3,111 | $2,192 | $2,846 | $2,883 | $2,120 | $2,973 |
| OCR | $2,246 | $1,460 | $1,871 | $2,263 | $1,532 | $1,965 |
| RCR | $2,645 | $1,820 | $2,205 | $2,867 | $2,011 | $2,356 |
Price movement by region (average transacted price) – non-landed homes excluding EC
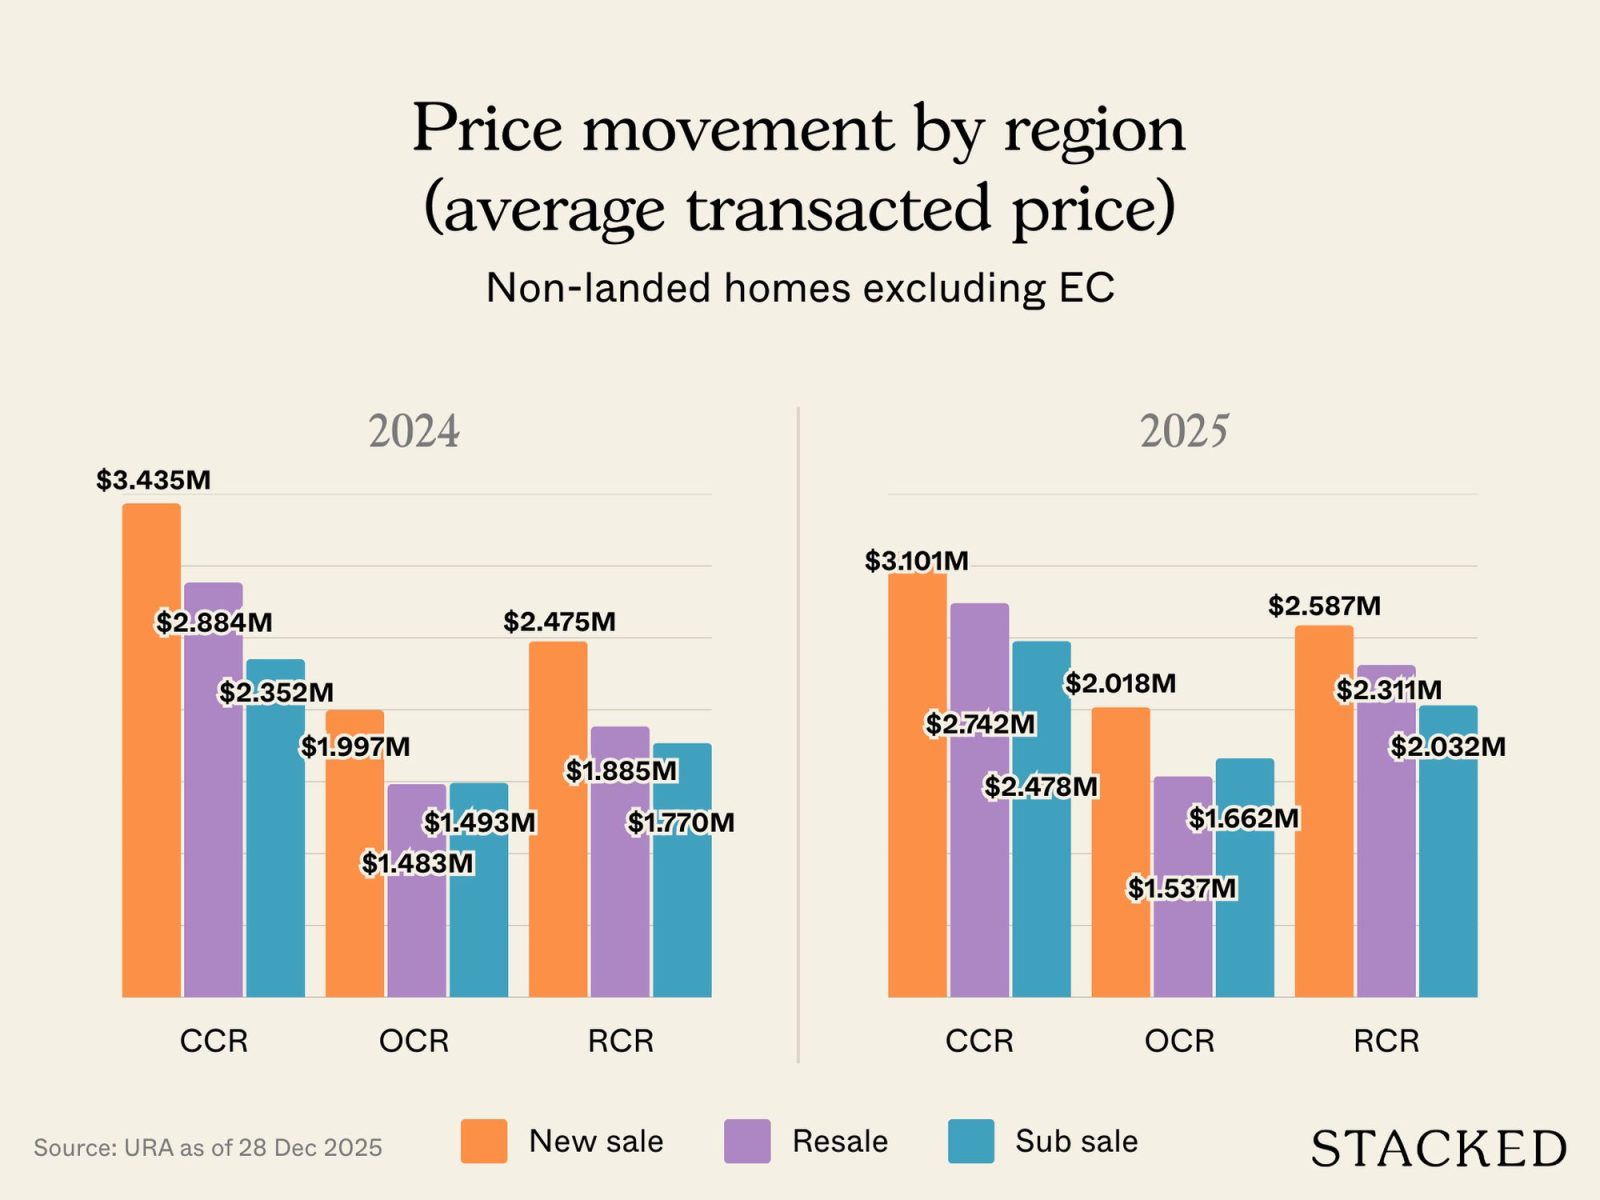
| 2024 | 2025 | |||||
| Region | New Sale | Resale | Sub Sale | New Sale | Resale | Sub Sale |
| CCR | $3,435,178 | $2,884,646 | $2,352,293 | $3,101,137 | $2,742,292 | $2,478,452 |
| OCR | $1,997,824 | $1,483,195 | $1,493,226 | $2,018,931 | $1,537,162 | $1,662,537 |
| RCR | $2,475,892 | $1,885,941 | $1,770,085 | $2,587,569 | $2,311,380 | $2,032,230 |
2-bedder price movement (average $PSF) – non-landed homes excluding EC
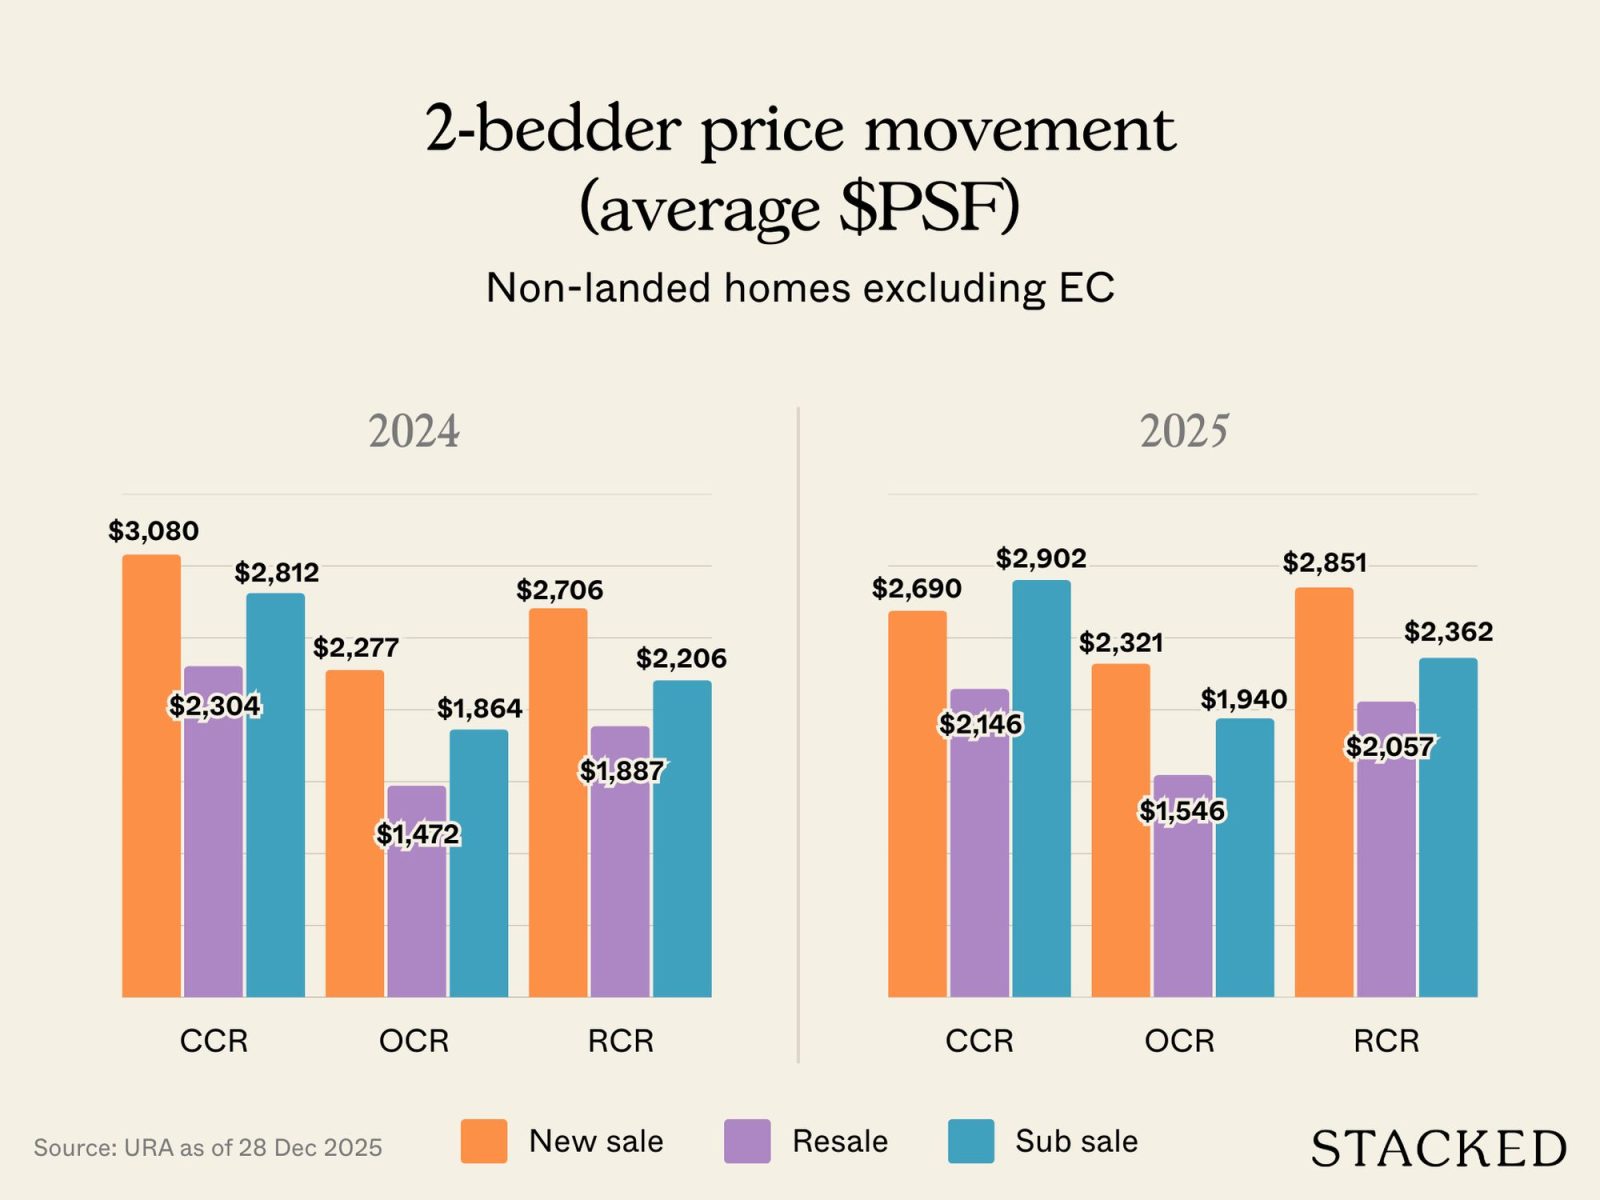
| 2024 | 2025 | |||||
| Region | New Sale | Resale | Sub Sale | New Sale | Resale | Sub Sale |
| CCR | $3,080 | $2,304 | $2,812 | $2,690 | $2,146 | $2,902 |
| OCR | $2,277 | $1,472 | $1,864 | $2,321 | $1,546 | $1,940 |
| RCR | $2,706 | $1,887 | $2,206 | $2,851 | $2,057 | $2,362 |
2-bedder price movement (average transacted price) – non-landed homes excluding EC
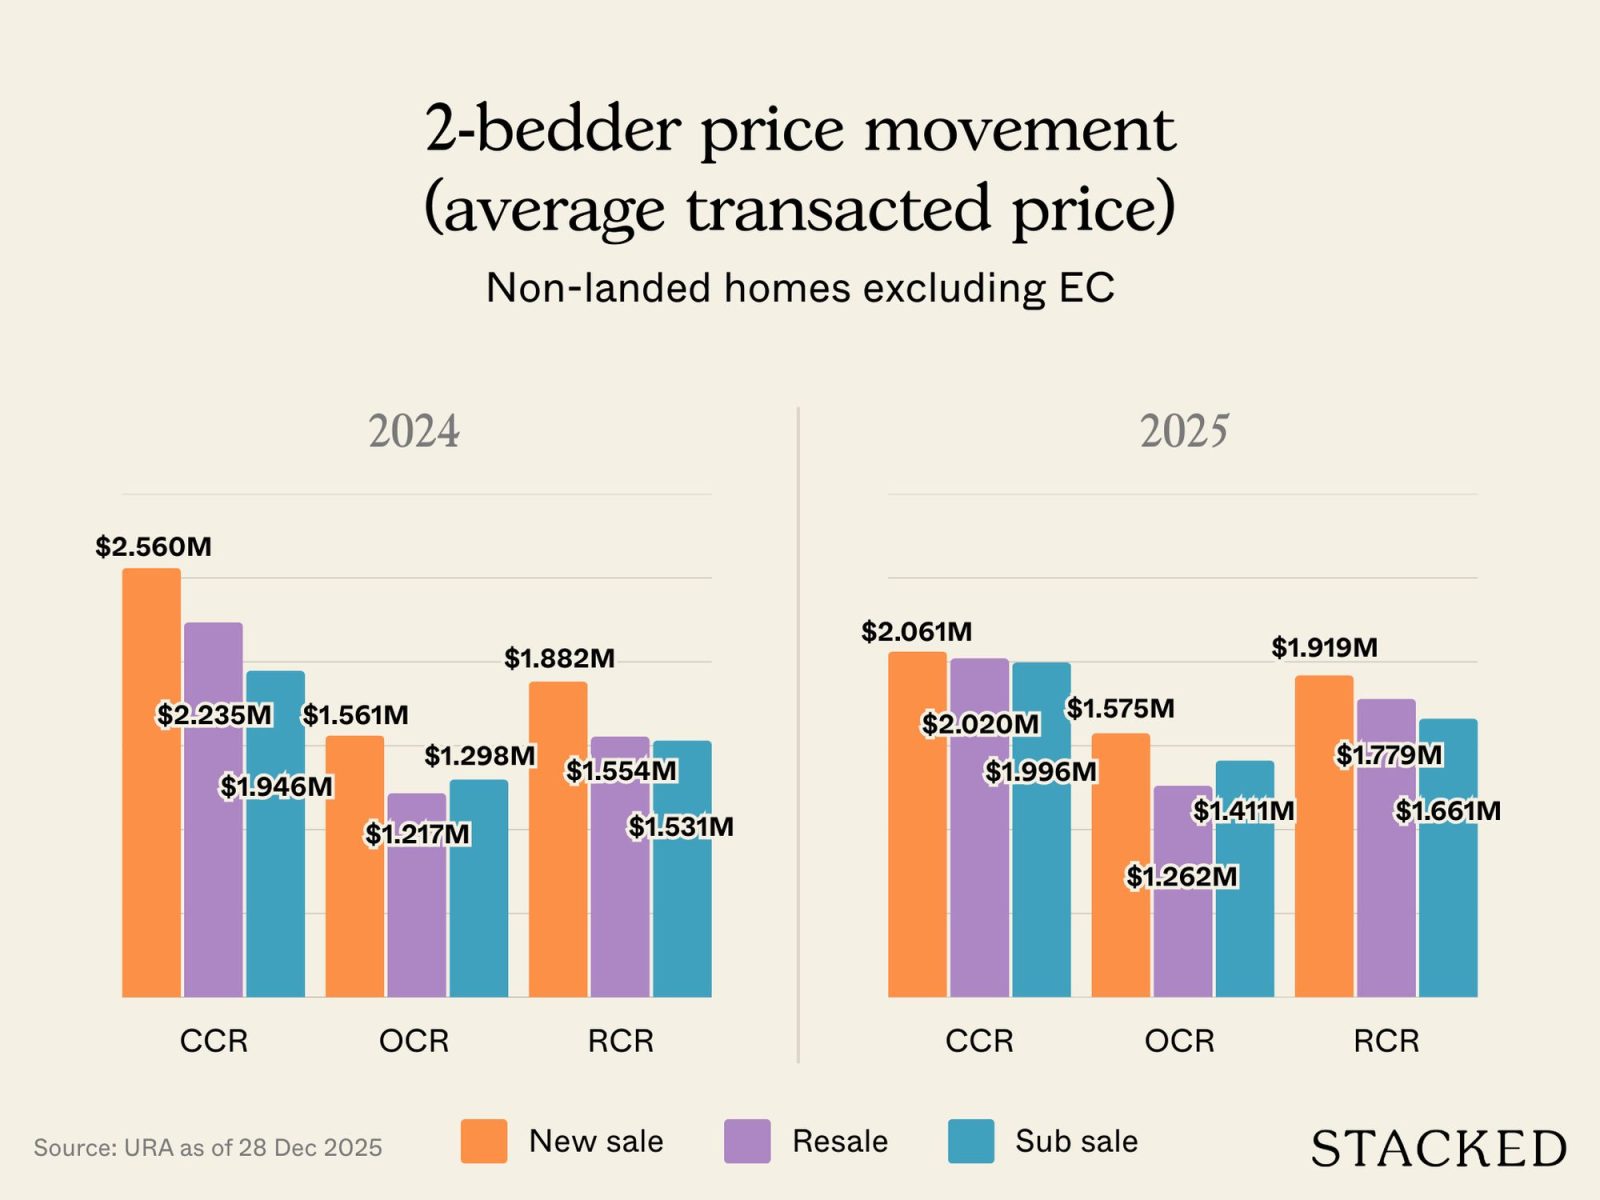
| 2024 | 2025 | |||||
| Region | New Sale | Resale | Sub Sale | New Sale | Resale | Sub Sale |
| CCR | $2,560,119 | $2,235,794 | $1,946,991 | $2,061,957 | $2,020,668 | $1,996,231 |
| OCR | $1,561,761 | $1,217,082 | $1,298,906 | $1,575,101 | $1,262,202 | $1,411,862 |
| RCR | $1,882,747 | $1,554,848 | $1,531,227 | $1,919,641 | $1,779,695 | $1,661,449 |
3-bedder price movement (average $PSF) – non-landed homes excluding EC
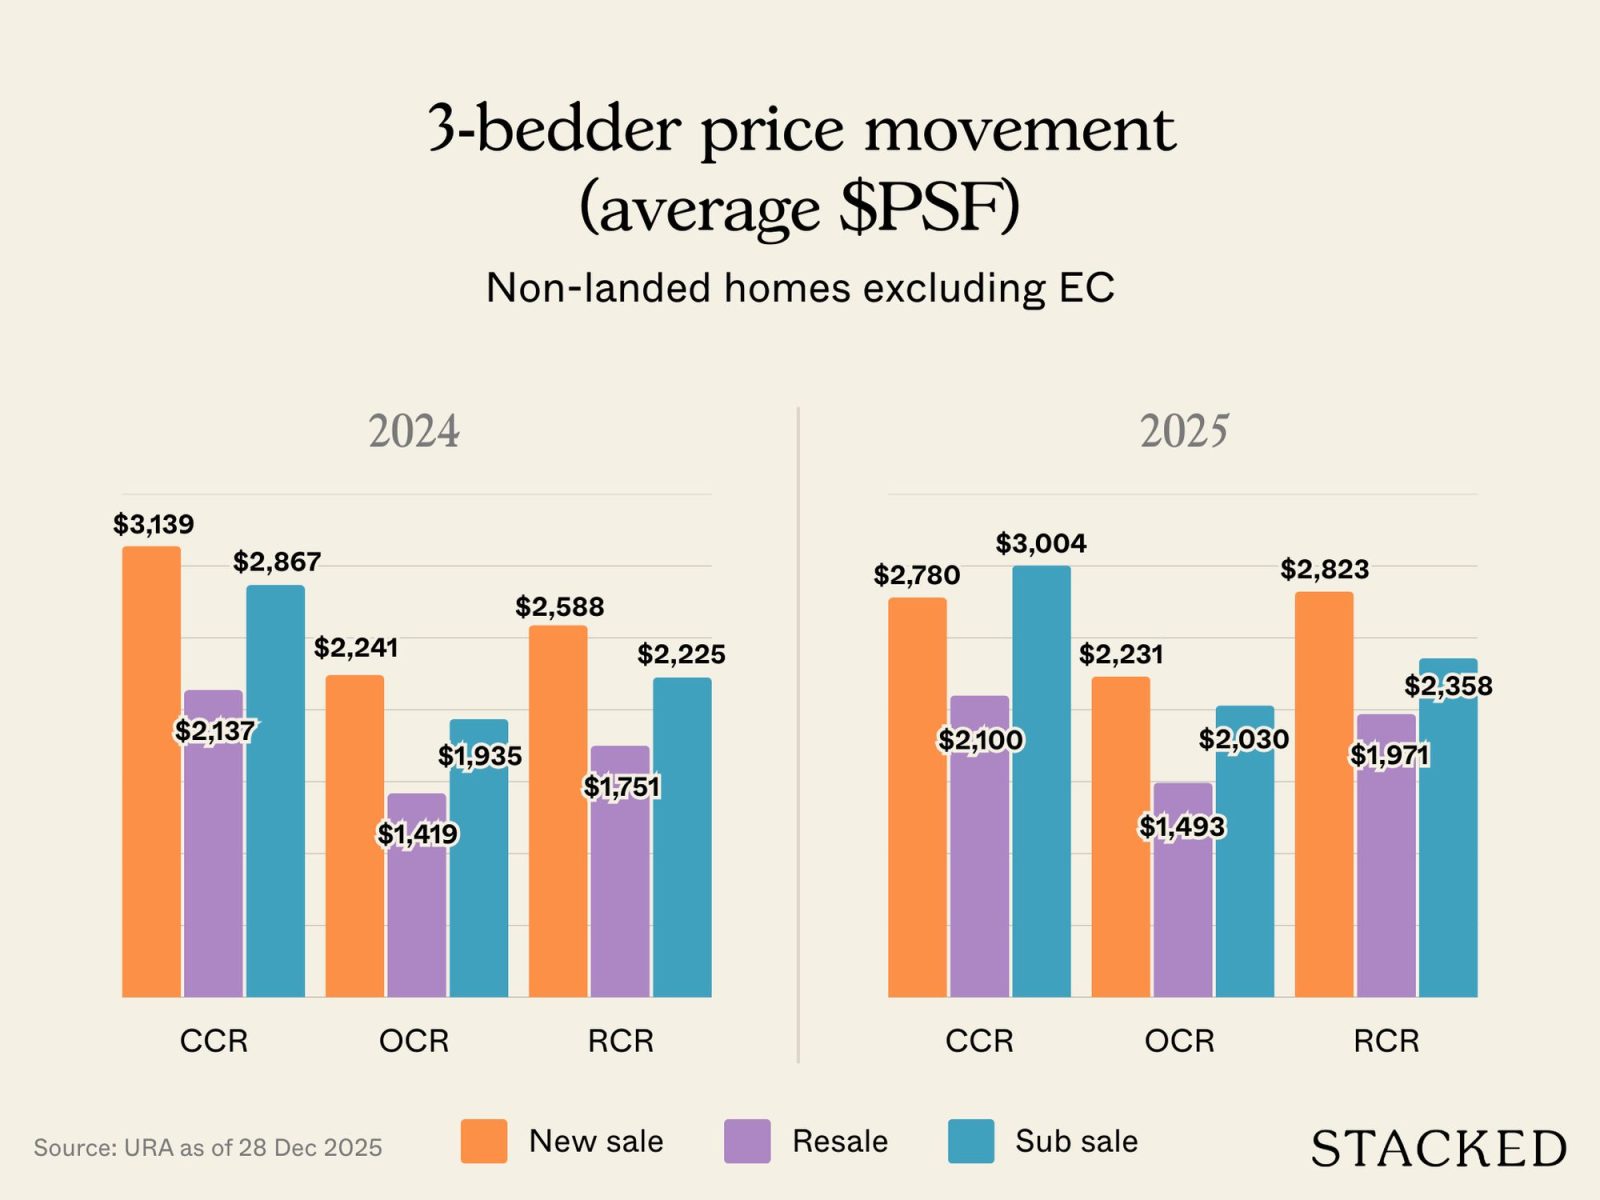
| 2024 | 2025 | |||||
| Region | New Sale | Resale | Sub Sale | New Sale | Resale | Sub Sale |
| CCR | $3,139 | $2,137 | $2,867 | $2,780 | $2,100 | $3,004 |
| OCR | $2,241 | $1,419 | $1,935 | $2,231 | $1,493 | $2,030 |
| RCR | $2,588 | $1,751 | $2,225 | $2,823 | $1,971 | $2,358 |
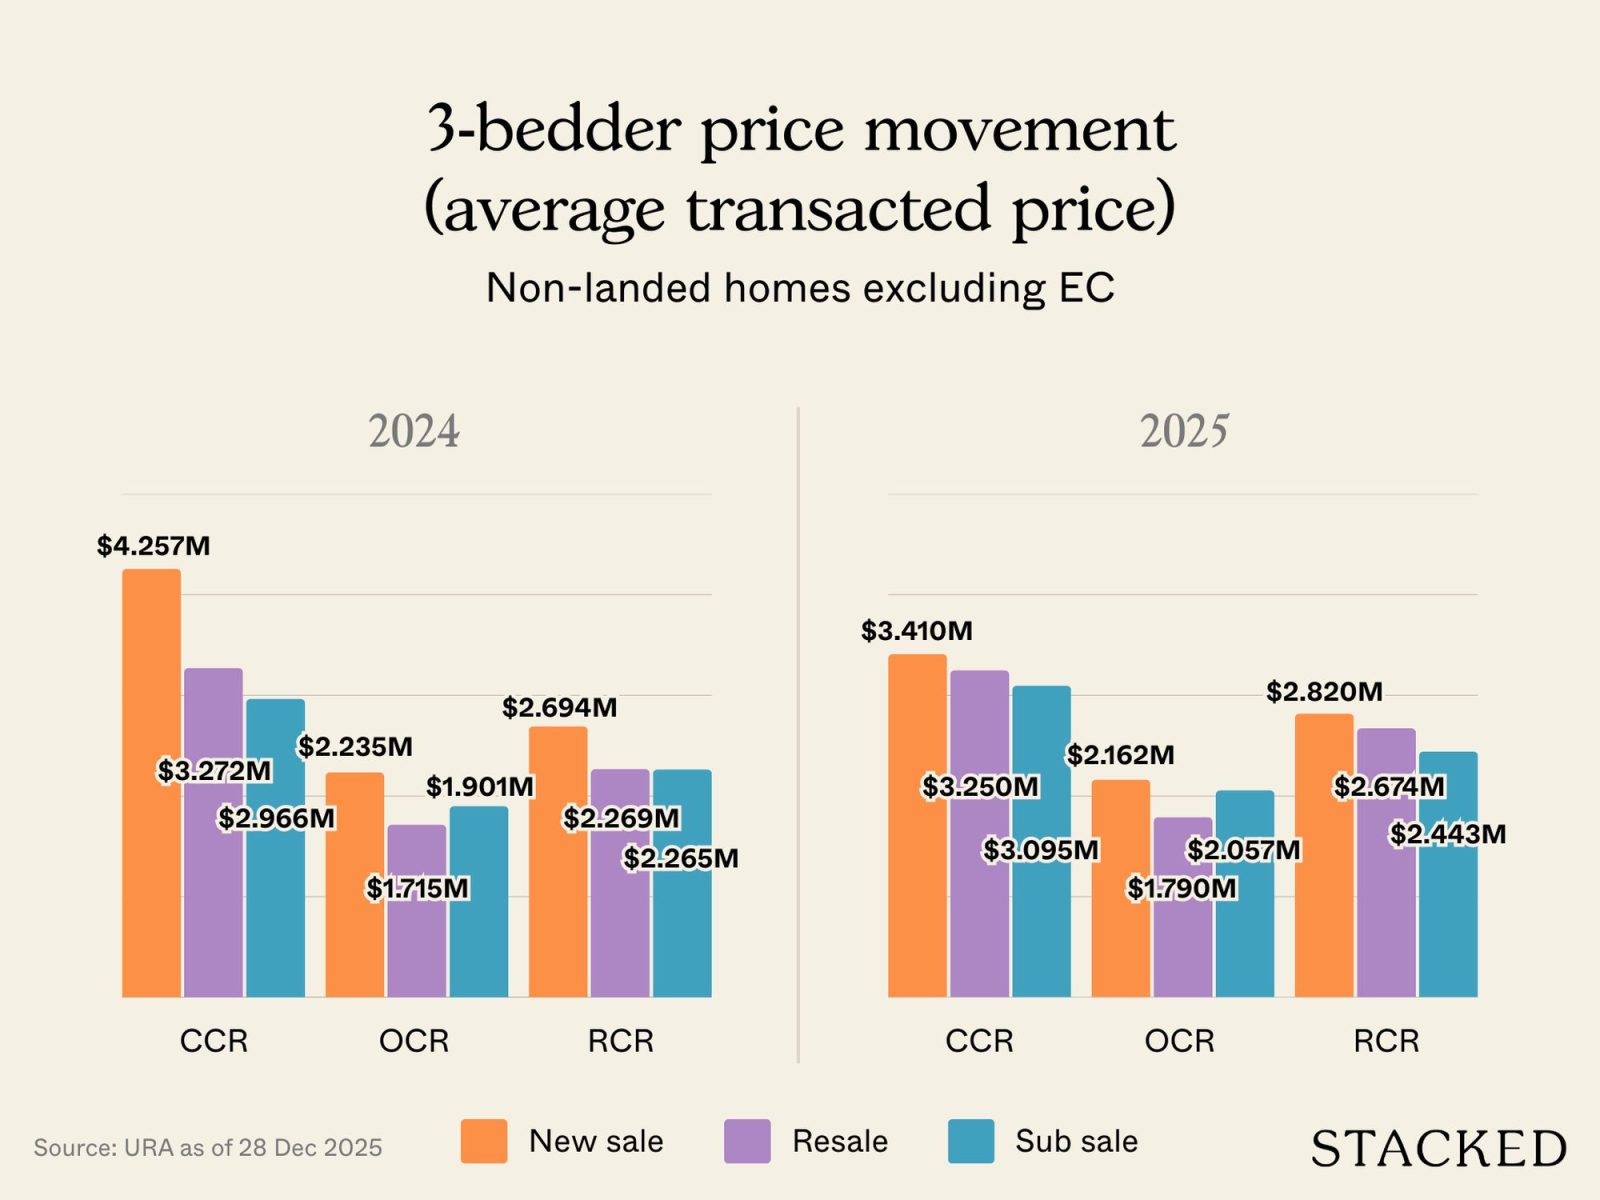
3-bedder price movement (average transacted price) – non-landed homes excluding EC
| 2024 | 2025 | |||||
| Region | New Sale | Resale | Sub Sale | New Sale | Resale | Sub Sale |
| CCR | $4,257,826 | $3,272,562 | $2,966,538 | $3,410,334 | $3,250,620 | $3,095,808 |
| OCR | $2,235,108 | $1,715,893 | $1,901,291 | $2,162,495 | $1,790,867 | $2,057,764 |
| RCR | $2,694,105 | $2,269,114 | $2,265,425 | $2,820,386 | $2,674,180 | $2,443,437 |
Even so, the practical realities of rising land costs mean that the “sweet spot” for upgraders – around $1.8 million to $2 million – tended to result in two-bedders or compact three-bedders (e.g., 2+Study units) being the only real options for some buyers.
With a pivot back to the OCR however, there’s a greater chance of finding family-sized three-bedders at the same price range. Back in 2025, for instance, we saw that Canberra Crescent Residences in Sembawang (District 27) managed to keep three-bedders in the price range of $1.6 million to $1.9 million. We also saw that the pricing strategy of Springleaf Residence (District 26) kept close to the affordability sweet spot: around $1.9 million to $2.1 million for a three-bedder unit.


